Price Lags. Open Interest Leads.
By CryptoTraders · Algos · 2026-05-22
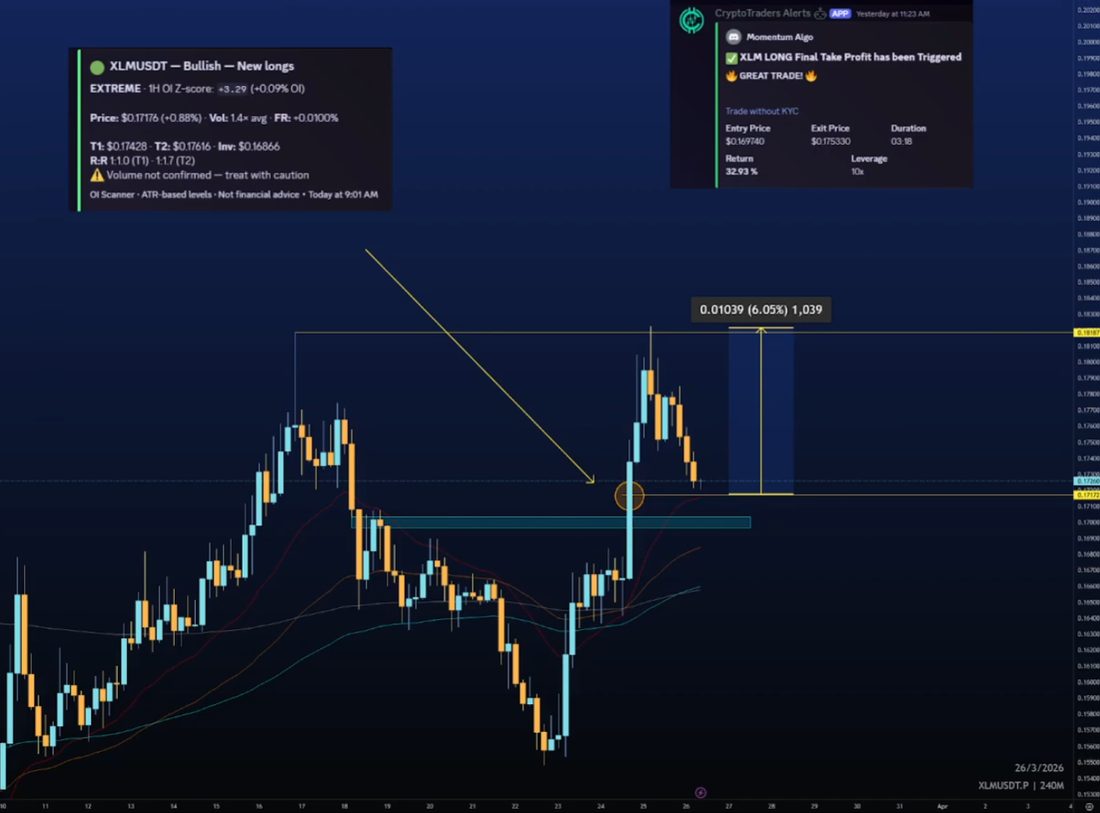
Price tells you a trade happened. Open interest tells you a position was opened. Those are two very different signals, and only one of them tells you whether new money is behind a move.
When a candle closes green, you know someone bought. You don't know if it was a fresh long, a short closing, or both at once. The candle is ambiguous. Open interest is not. When OI rises alongside the move, new capital is committing in the direction of price. When OI falls, the move is being driven by positions closing, and the trend has less behind it than the chart suggests. This guide covers what open interest measures, the four ways it combines with price, the traps in how it is usually displayed, and a step-by-step way to read it on any crypto perpetual.
What open interest actually measures
Open interest is the number of derivative contracts that are open and not yet settled. Every perpetual futures contract has two sides, a long and a short, so one contract of OI always means one long position and one short position of the same size. That is why OI can never tell you whether the market is net long or net short. It tells you how much is committed, not which side is winning the argument.
OI changes only when a trade creates or retires a contract. Whether it does depends on who is on each side of the trade:
| Buyer | Seller | Effect on open interest |
|---|---|---|
| Opens a new long | Opens a new short | Rises: a new contract is created |
| Opens a new long | Closes an existing long | Unchanged: the position changes hands |
| Closes an existing short | Opens a new short | Unchanged: the position changes hands |
| Closes an existing short | Closes an existing long | Falls: a contract is retired |
This is also the cleanest way to separate open interest from volume. Volume counts every trade, including positions just changing hands. Open interest counts what is still on the table after the trading is done. A session with enormous volume and flat OI was mostly churn. A quiet session where OI climbs steadily is positions being built, and positions eventually have to be closed, which is where future moves come from.
The four quadrants: reading price and OI together
Cross the direction of price with the direction of open interest and every move the market makes lands in one of four boxes. The candle looks identical in the confirming and unwinding cases. The quadrant tells you which one you are looking at.
| Price | Open interest | What is happening | How it tends to behave |
|---|---|---|---|
| Up | Up | New longs opening | Trend has fresh capital behind it |
| Up | Down | Shorts covering | Sharp but self-limiting once covering ends |
| Down | Up | New shorts opening | Downtrend with conviction behind it |
| Down | Down | Longs liquidating or closing | Painful, but selling pressure runs out |
Price up, OI up: new longs. Fresh capital is committing to the upside. This is the healthiest form of a rally, and the trend has fuel for as long as the pattern holds. Pullbacks inside this quadrant are more likely to be bought than to reverse the move.
Price up, OI down: short covering. The move is driven by shorts buying back, not buyers arriving. Covering rallies can be violent, but they are self-extinguishing: once the trapped shorts are out, the bid disappears. Treat strength on falling OI with suspicion, especially into resistance.
Price down, OI up: new shorts. Fresh capital is committing to the downside. It is the first quadrant inverted, a trend with conviction behind it, and bounces inside it tend to get sold.
Price down, OI down: long liquidation. Longs are giving up, voluntarily or by force. It hurts while it happens, but it is positions leaving the market rather than new bets against it, and when the unwind exhausts itself the selling pressure is simply gone. Capitulation lows form in this quadrant, usually with a sharp OI drop as stops and liquidations clear in a single flush.
The most reliable reads come at extremes. A sharp rally on falling OI into a level that has rejected price before is a short-covering pop far more often than a breakout. A flush where OI collapses alongside price, often with funding swinging negative, is how bottoms get carved.
The USD open interest trap
Most dashboards show open interest in dollars, because it is easier to compare across coins. Dollar OI is contracts multiplied by price, which means it moves with price even when not a single new position opens. If a coin rallies 10% and nobody opens or closes anything, dollar OI still rises 10%. Read that as new longs and you will see conviction that is not there.
The fix is simple. Where the exchange offers it, read open interest in coin or contract terms. Where it does not, compare the percentage change in OI against the percentage change in price over the same window. Dollar OI up 12% on a 10% rally is roughly 2% of genuinely new positioning. Dollar OI up 12% while price is flat is the real thing.
Two other details trip people up. Aggregated OI across exchanges is more representative than any single venue, but it blends venues with different user bases and different contract specifications. And a sudden OI drop with no matching price move can be a single large position closing or being transferred, not a market-wide unwind. Check whether the drop is spread over time or concentrated in one candle.
Why the threshold has to adapt to the asset
Every coin has its own volatility profile. Bitcoin's open interest swings on a different scale than a low-cap altcoin's. A flat percentage threshold for unusual activity will either catch noise on quiet assets or miss real moves on volatile ones. The honest approach is statistical: how unusual is this change relative to this asset's own history?
That's what a Z-score does. It measures how many standard deviations the current OI change sits from the asset's normal range. Say a coin's hourly OI change averages +0.3% with a standard deviation of 0.5%. A +2.3% hour is a Z-score of +4, a genuinely rare event for that coin. The same +2.3% on a coin whose hourly OI routinely swings 3% is a Z-score below 1, and it means nothing. The Z-score puts BTC and a low-cap on the same scale.
An OI surge alone is not a signal
A spike in isolation is a clue, not a conclusion. Sometimes it's coordinated positioning ahead of a real move. Sometimes it's a thin-liquidity squeeze that fades within the hour. The difference shows up in the surrounding context, and the more of these readings agree, the harder the move is to fake:
- Higher-timeframe trend: is the surge with the 4-hour or daily structure, or against it?
- Price direction during the surge: which quadrant is the move in?
- Volume: does real traded volume confirm the print, or is OI moving on a quiet tape?
- Funding rate: is the crowd already paying heavily to hold the same side?
- Momentum and RSI position: is the move starting fresh, or already stretched?
- Liquidity: is the book deep enough to hold the move once the first wave is done?
Funding is the tiebreaker when the read is unclear. New longs plus rising funding means the crowd is paying more and more to be long, which raises the risk of a long squeeze. New shorts plus deeply negative funding means the downside is crowded, and the snap-back gets closer. A liquidation heatmap shows where that crowded positioning would be forced out.
How to read open interest, step by step
- Open the price chart and the open interest chart for the pair on the same timeframe. The 1-hour is a good default for intraday reads; use the 4-hour for swing context.
- Switch OI to coin or contract terms if you can. If you only have dollar OI, compare its percentage change with price's.
- Label the current move with its quadrant: new longs, short covering, new shorts or long liquidation.
- Measure how unusual the OI change is against the coin's own recent range, not against other coins.
- Check funding and volume. Confirming quadrants with moderate funding and real volume are the clean ones; extreme funding means the trade is crowded.
- Place the move on the higher-timeframe structure. A confirming quadrant into major resistance is still a move into resistance.
- Write down what would invalidate the read, such as OI rolling over while price keeps rising. If it happens, the quadrant has changed and so has the story.
Common open interest mistakes
- Reading rising OI as bullish. Rising OI means more positions on both sides. Direction comes from price, funding and who is paying whom.
- Treating dollar OI as positioning. A rally inflates it automatically.
- Comparing raw OI changes across coins. A 2% change means different things on BTC and on a low-cap.
- Ignoring the unwind quadrants. Short covering and long liquidation produce the fastest candles on the chart, and both run on a finite tank.
- Using OI on its own. It is the context for a trade, not a trade.
Where the OI Scanner and Momentum Algo fit
Trading Algorithms: Four algorithms trading 24/7, every call posted live with entry, stop, targets and the reasoning attached. See the algorithms
What's hard to do manually is keep this watch running across every Bybit USDT perpetual with meaningful open interest, every hour, without missing anything. The OI Scanner does that as an informational feed: it Z-scores each coin's OI change against that coin's own history, flags Notable surges at 2.0 and above and Extreme ones at 3.0 and above, and attaches a bias label (bullish, bearish, squeeze risk or coiling) so you can see at a glance which kind of move it is. Members see the same read in the Tools Terminal, coin by coin.
Momentum Algo builds a trading system on the same idea. It scans every Bybit USDT perpetual with meaningful open interest on the 1-hour timeframe with a 4-hour trend bias. Its primary trigger is a Z-score normalized OI surge, and every trigger then runs through a seven-factor confluence stack: trend, momentum, volume, funding, RSI, price direction during the surge, and liquidity. The alert shows the actual values from each check rather than a single confidence number, and stops and targets are ATR-based so each coin's own volatility sets the risk.
Its full record is public. As of October 20, 2026, Momentum Algo stood at 235 wins and 236 losses across 471 tracked trades, for +116.0R. It loses half the time, and the record is positive because the average winner is larger than the average loser, measured in units of risk. That is what reading open interest well looks like in practice: no magic hit rate, just a repeatable way of telling committed capital from noise. Past performance does not guarantee future results.
The XLM long on the cover is a clean example of a confirming quadrant. Open interest surged with price on the 1-hour, entry filled at $0.169740 and the final take profit triggered at $0.175330, a 3.29% price move closed in three hours and eighteen minutes. On a leveraged position that move is magnified, and so is every loss, which is why the record is kept in R rather than in leveraged percentages.
Educational content, not financial advice. Trading leveraged products carries a high risk of loss.